


Tracking Data was a Red Herring
It's not anymore.

Tracking data has required an immense amount of research and development to yield dividends that were far from certain at the outset. For years, it served as a dangerous distraction from other more important topics that soccer analysts should have been attending to.
It’s not anymore. Broadcast tracking data has changed the calculus of resource allocation inside of soccer organizations and practical tracking data research is no longer exclusive to academic circles.
It had potential in the High Performance and Sport Science discipline, but those practitioners typically prefer accelerometer and GPS-based player monitoring systems. This is for good reason — wearables are used identically in both game and practice settings, granting the luxury of reasonable apples-to-apples comparisons across environments.
In the Performance Analysis and Video discipline, it can absolutely give you a much deeper understanding of how your team and opponent behave tactically and quantify game-model relevant measures. But the dividends here have a low ceiling. And the floor is gradually being lifted by genuinely good in-game tooling offered across the industry.
The last team operations discipline is Player Recruitment. With a few notable exceptions, scouting departments could not acquire tracking data on a majority of players they were monitoring and therefore couldn’t take full advantage of the tracking data research that was burgeoning within the performance analysis or sport science domains. Without this economy of scale, truthfully, tracking data wasn’t really a compelling investment on an organizational level1.
However, tracking data sings a siren song. The richness of the data can be irresistible to someone who is fascinated with how the game functions at an atomic level and has the technical skills to potentially unlock secrets. I’ve learned a lot from working with tracking data, but I have also paid an opportunity cost.
The primary value of tracking data research has been indirect. It allows you to demonstrate an understanding of the game and deep technical competency, which opens other more important doors. Because of this opinion, I’ve generally been very open with colleagues about what I’m working on with tracking data.
The world is changing rapidly with Broadcast Tracking data bursting upon the scene, widening the access to this spatial player data to any forward-thinking team. Suddenly, there is enough elbow-room to compete and potential motivation to speak less freely. But for the reasons discussed in a Previous Blog Post2, I still believe this industry will benefit from a default of transparency.
Hungarian soccer plays a foundational role in Jonathan Wilson’s frustratingly verbose Inverting the Pyramid. It’s one of the central threads in the book’s narrative about the evolution of football tactics – especially in how the game transitioned from fixed-to-fluid3 systems of play. Coincidentally, Hungarians also have invented some useful mathematics to demonstrate the concept.
I recently delivered a guest lecture on the Foundational Methods for (Soccer) Tracking Data and the concept that I concentrated on was the Hungarian Algorithm (i.e. Kuhn-Munkres). I think it’s one of the most under-utilized tools for evaluating player tracking data.
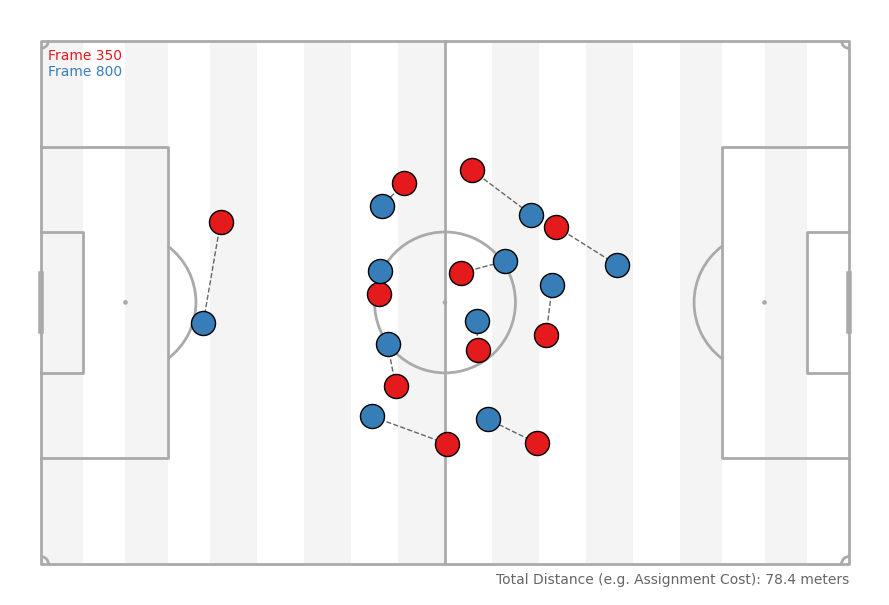
For our purposes, it can be used to compare two tracking frames. In the above visual4, we are comparing the location of home players in the 350th and 800th frame5 of Metrica’s sample data. After performing a team centroid normalization, the algorithm solves the assignment between a set of points by minimizing the (in this case6) euclidian distance. You can interpret this assignment cost as a crude measure of similarity7.
If this is at all unclear, I think the visual is very intuitive: we’re finding the combination of pairs which minimizes the combined distance of the dotted lines.
As it turns out, this is also an accidental solution to the pesky tracking data preprocessing issue of player-order invariance!
Tracking data gives you a set of player coordinates per frame, but it doesn’t tell you which coordinate belongs to which role or position. The ordering is arbitrary (ish). This creates a major problem when trying to feed tracking data into a machine learning model.
Machine learning models expect consistent, structured input – feature vectors where each element has a stable semantic meaning. But with unordered player positions, you don’t know whether the nth coordinate pair represents a center back or a left winger.
This means you can’t just flatten the coordinates and plug them into a model – the same player could be in a different column from frame to frame. Any learned patterns would be unstable or misleading.
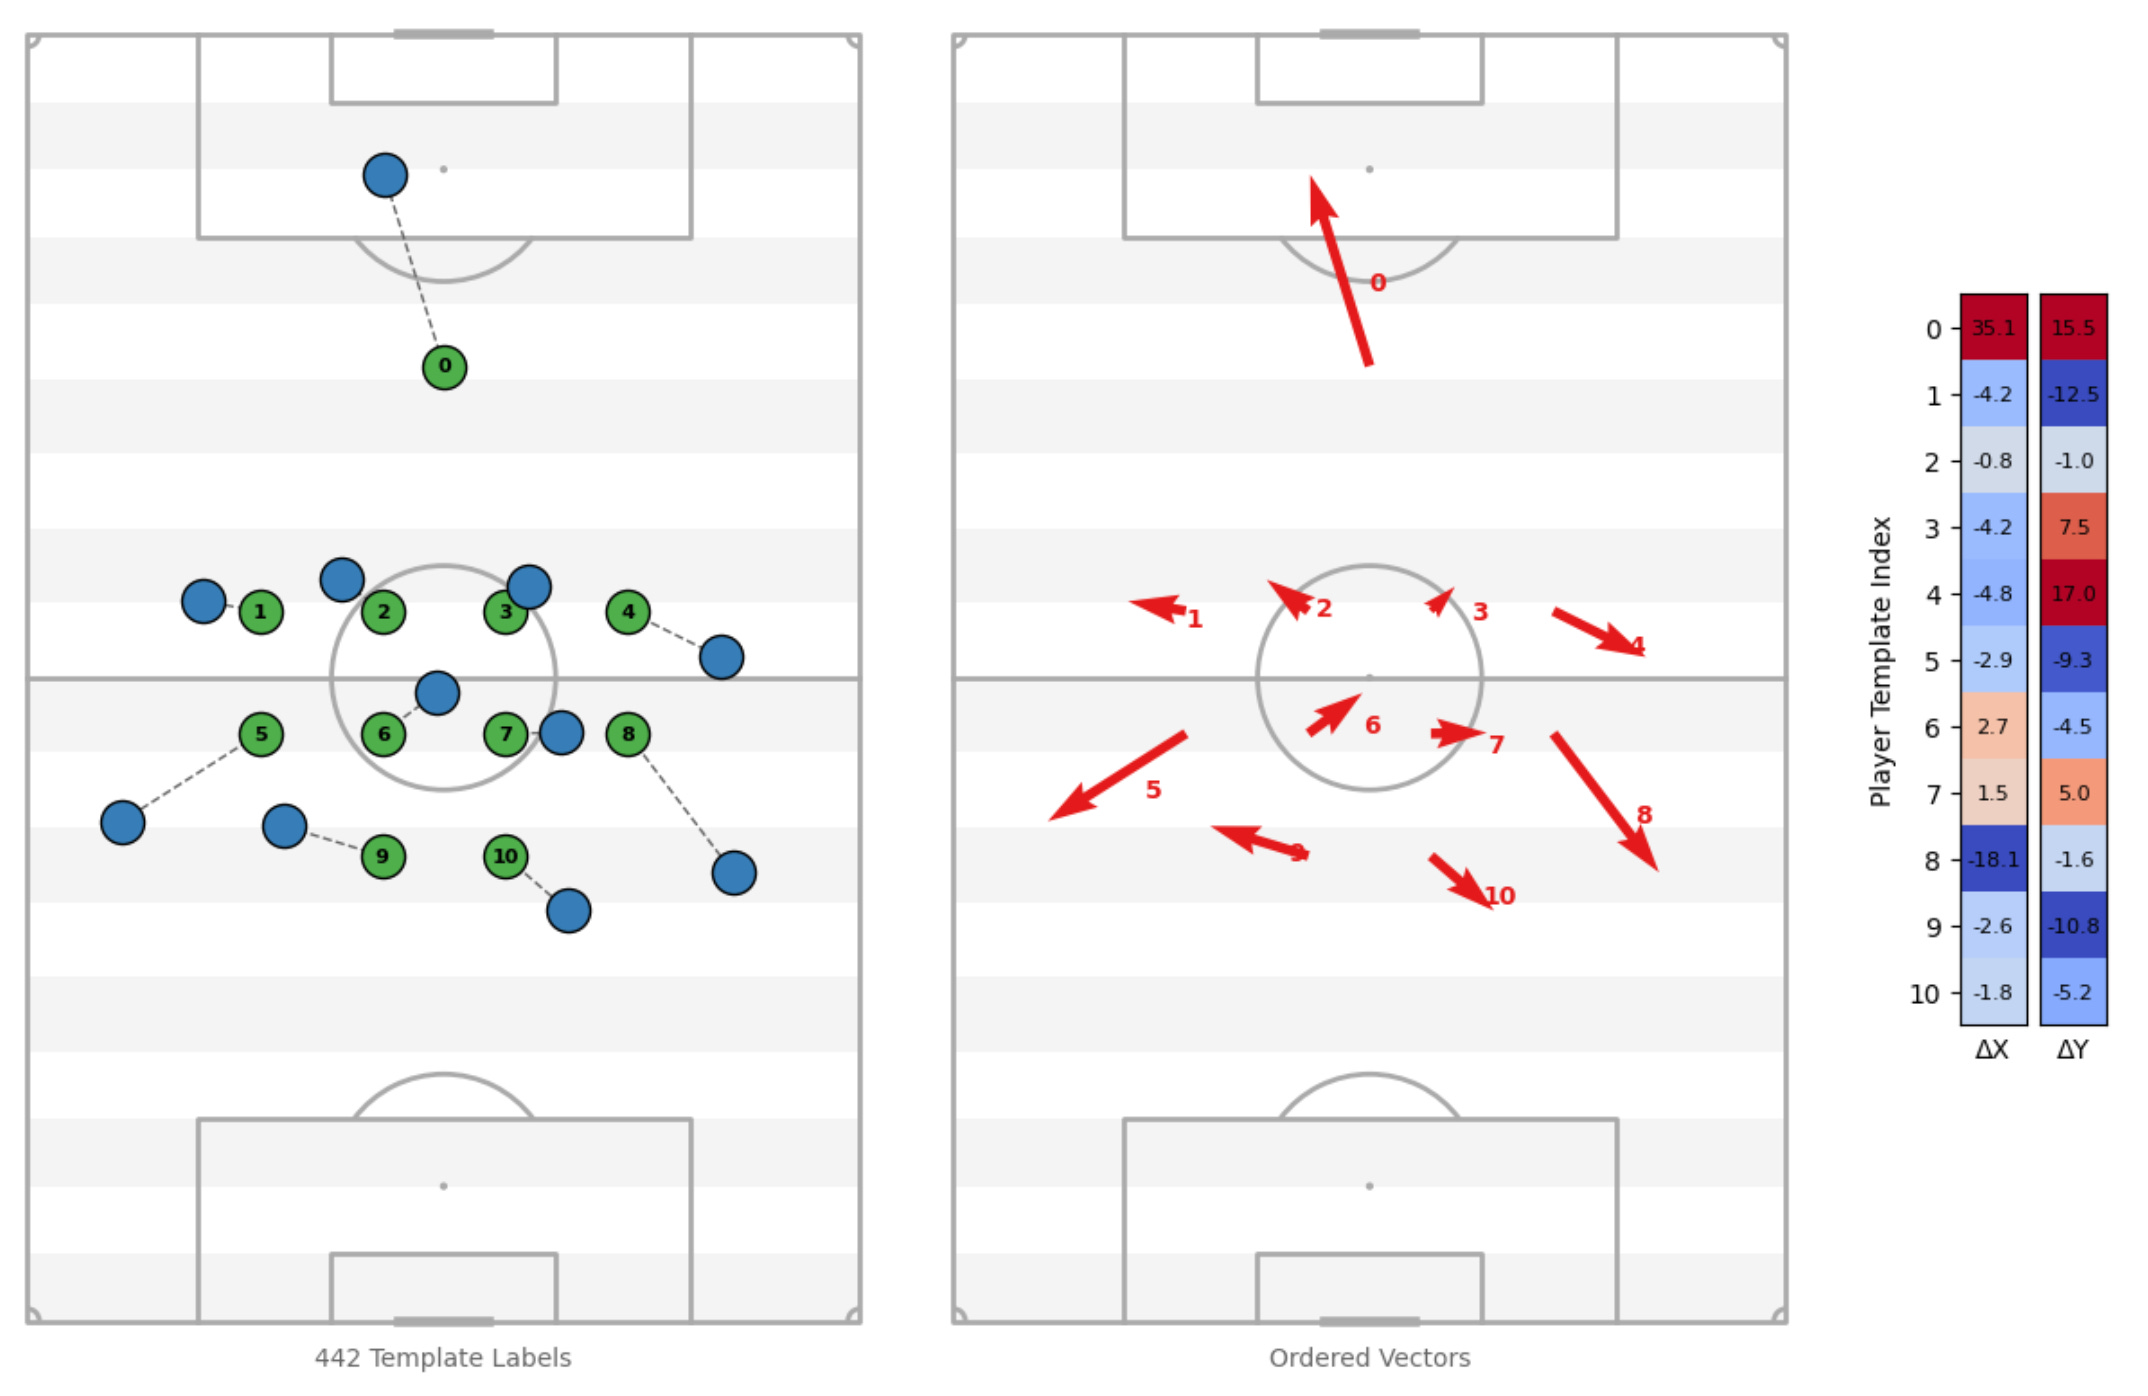
My proposed workaround is to compare each frame to a static positional template – a canonical formation, for example – and extract the displacement vectors8 for each role. This gives you a fixed-order, interpretable feature space: how each positional role deviates from the template at that moment in time.
There are a few established methods for addressing player order invariance, such as:
Convolution with a 1x1 kernel on dense tensors of relative player positions9.
Graph neural networks with players as nodes and relative metrics as edges, which I suspect is the way to go.
Each of these are genuine contributions to the field of sports analytics, and are individually superior to my suggested approach above for the purposes of actual applied situations. But, this quick and dirty approach can get you a pretty far toward answering a variety of different of questions.
Anyway, this was a bit of a meandering post across both industry commentary and tracking modelling minutia. Subscribe if you want more occasional parental-leave sleep-deprived scrawls.
Ian Graham implies a similar insight in his recent book How to Win the Premier League when mentioned his first exposure to Will Spearman’s presentations on Pitch Control were “the first times I’d seen anyone doing anything sensible with tracking data”.
Which was actually referenced in a Cool New Paper by David Radke. I’m blushing.
Fixed to Fluid: Frame-by-Frame Role Classification – thematically similar prior research.
At 25fps, these frames are 18 seconds apart, so it’s unsurprising that they’re pretty similar – but you can easily find even closer matches across larger time spans.
This doesn’t have to be euclidian! In fact, in Shaw and Glickman’s Dynamic analysis of team strategy in professional football, they utilize the Hungarian Algorithm with Wasserstein distance to compare distributions of player positions! Really super smart.
This is sneaky-useful way to detecting and filtering set piece situations (or goal celebrations) because the assignment cost explodes in these obscure moments.
In this example, I’ve used ΔX and ΔY, but you could just as easily use a magnitude and angle of displacement – which might actually be better.
Honestly, I still don’t really understand how this works. Anyone want to write a guest post that explains it?
Hi Devin, nice write up as usual. Re footnote 9 it looks like the convolution might not really be typical convolution (given it's being applied to specific elements alone?) and it's more the pooling that effectively makes the behaviour "set-like" through aggregation as opposed to an ordered calculation.
https://www.kaggle.com/c/nfl-big-data-bowl-2020/discussion/119400#727631
To add to the possible player order invariance options there's an interesting paper deploying set-attention which looks like a promising direction you may be interested in:
https://arxiv.org/abs/2410.17785